
This article appears in the May 2020 issue of Investment Executive. Subscribe to the print edition, read the digital edition or read the articles online.
Covid-19 has turned the financial world upside down. Fortunately, the average advisor’s book was in exceptionally good shape heading into the economic crisis, with assets and productivity hitting record levels.
The research for this year’s edition of the Brokerage Report Card was completed before pandemic fears rocked financial markets in late February — so while conditions have shifted significantly since then, the data provide a clear view of the industry’s pre-crisis starting point.
In the run-up to the collapse, the hardy markets that prevailed over much of the past year boosted assets under management (AUM).
The S&P/TSX composite index hit a record high of 17,944 on Feb. 20 before tumbling to levels not seen since the aftermath of the global financial crisis of 2008-09. Similarly, the Dow Jones Industrial Average reached almost 30,000 in mid-February, before plunging rapidly to around 18,600 in the weeks that followed.
The markets’ strong pre-pandemic results also pushed brokerage industry assets to record highs. In this year’s Report Card, the average advisor boasted more than $200 million in average AUM for the first time, rising to $201.3 million from $176.7 million in 2019.
At the same time, advisors trimmed their client lists to focus on their wealthiest, most productive clients. The average advisor in this year’s Report Card served 184 client households, down from 193 last year.
Click image for full-size chart
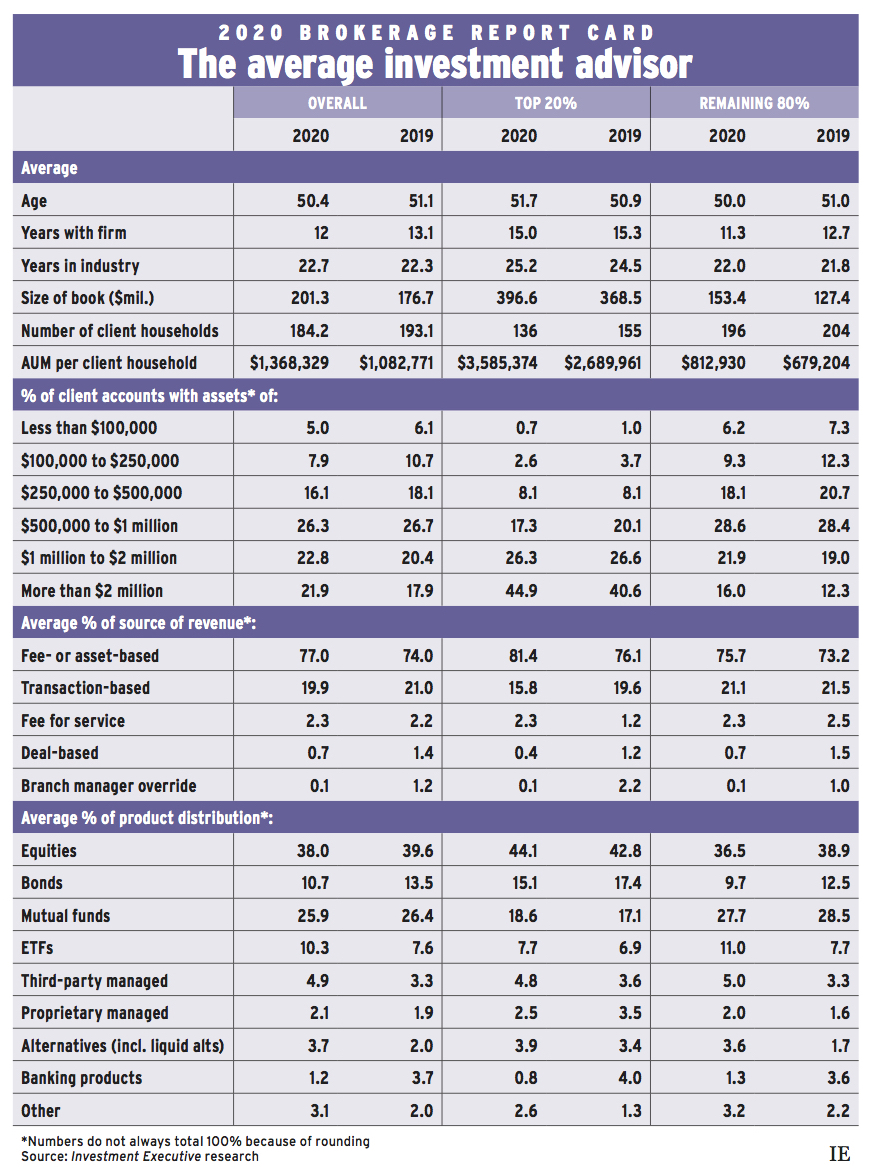
This combination of smaller client numbers and a robust rise in AUM helped generate a surge in advisor productivity (as measured by AUM per client household). In last year’s Report Card, average productivity was just shy of $1.1 million. This year, it was nearly $1.4 million.
The increase in average productivity also was reflected in account distribution data, which pointed to ongoing growth in the proportion of million-dollar accounts. Accounts worth more than $1 million composed 44.7% of the average book, up from 38.3% in 2019’s Report Card. Conversely, allocations to each account category under $1 million were down from last year.
This growth in high-end accounts was strongest for accounts valued at more than $2 million, which represented 21.9% of the average advisor’s book, up from 17.9% in 2019. This trend was particularly evident among the industry’s top producers.
Dividing the overall Report Card population into the top 20% (as measured by AUM per client household) and the other 80%, the data showed that allocations to accounts worth at least $2 million were up this year for both those segments. However, among the top 20% of advisors, that category was the only one that increased its share of the average book.
This year, top producers reported that 44.9% of their business was devoted to the accounts worth at least $2 million, up from 40.6% in last year’s Report Card. Allocations to every other account category declined year-over-year.
For the other 80% of advisors, allocations to higher-value accounts also increased, albeit from a lower starting point. For these advisors, allocations to accounts worth at least $2 million jumped to 16.0% this year from 12.3% last year.
Accounts worth less than $500,000 made up only one-third of the average book for the remaining 80% of advisors (33.6%), down from 40.3% last year. Moreover, just 15.5% of the average advisor’s book was devoted to accounts worth less than $250,000 (down from 19.6% last year).
With assets rising year-over-year and client numbers down, average productivity rose substantially, too. However, the data point to divergent underlying trends in the basic composition of advisors’ books.
For the top performers, asset growth was more modest than it was for the rest of the industry. Nevertheless, their productivity grew rapidly, as these advisors focused more intently on culling their client bases.
In this year’s Report Card, average client numbers for top performers declined to 136 from 155 in 2019. At the same time, their average AUM rose to $396.6 million this year from $368.5 million last year. As a result, the average AUM per client household surged to almost $3.6 million this year from slightly less than $2.7 million last year.
For the rest of the industry, the drop in client numbers was more modest, and the rise in assets much stronger. For these advisors, the average client roster edged down to 196 this year from 204 last year — but average assets rose by more than 20%, growing to $153.4 million from $127.4 million.
Some of this asset growth was likely due to market gains among existing clients. Given that top producers were actively trimming their client numbers, the rest of the industry could have boosted assets by capturing high-end castoffs.
As a result of these trends, the rest of the industry also saw its average productivity rise by about 20% from last year; average AUM per client household increased to $812,930 this year, from $679,204.
The impacts of this year’s dramatic market downturn on clients’ portfolios and asset mix won’t be evident until next year’s Report Card, but this year’s research provides insight into how advisors’ books were structured heading into the crash.
One worrying sign is that allocations to relatively “safe” assets were down notably this year. Overall, banking products dropped to just 1.2% of the average book, from 3.7% last year, and bond allocations were down to just 10.7% this year from 13.5% last year.
Equities remained the top holding in the average book, down a bit to 38.0% from 39.6% in last year’s Report Card. Mutual funds continued to represent the second-biggest allocation, at 25.9%, down slightly from 26.4% last year.
Conversely, allocations to ETFs rose sharply this year, to 10.3% of the average book, up from 7.6% last year.
Advisors also reported shifts in asset allocation on the margins. For example, 4.9% of the average advisor’s book was allotted to third-party managed products, up from 3.3% in last year’s research. Given that 2019 was the first full year that liquid alternatives were available to retail investors, allocation to these products almost doubled, up to 3.7% from just 2.0% last year.
While increasing exposure to alts may provide some protection from falling markets, equities remained the biggest component of most books, followed by mutual funds, which also may include large equity exposures.
March data from the Investment Funds Institute of Canada indicate ETF and mutual fund assets had each dropped about 10% month-over-month. This decline was a combination of redemptions and a reflection of the damage inflicted by market turmoil.
Advisors’ revenue will also be affected by this turmoil as the industry’s reliance on asset-based compensation models continues to grow. About 80% of industry revenue captured in this year’s Report Card was generated from fees (77.0% asset-based revenue and 2.3% fee-for-service arrangements), up a bit from last year.
The extreme market volatility and economic fallout flowing from the Covid-19 outbreak will dent the finances of investors and advisors alike — the good news, at least, is that both appear to have entered the crisis on a high.