
Financial advisors in our previous 2019 Report Cards have reported strong growth in their books over the past year, and the branch-based bank advisors of the Big Six appear to be sharing in the bounty.
The latest edition of Investment Executive (IE)’s Report Card on Banks found the average bank advisor surveyed enjoyed a robust increase in assets under management (AUM) over the past 12 months, and that this asset growth fuelled productivity gains.
Some of the gains may have reflected the relatively strong rebound in stock markets earlier this year. Through the first five months of 2019 – IE’s bank research takes place between April 1 and the beginning of May – the S&P/TSX composite and the major U.S. indices posted double-digit percentage gains.
Nonetheless, the hefty rise in AUM and the accompanying productivity improvement suggest the Big Six are gaining a greater share of the high net-worth segment.
Click the image below to download a full-size version of the chart.
This year’s data on industry assets and productivity excludes advisors with Toronto-based Bank of Nova Scotia, who serve assigned groups of clients out of a collective base, and thus cannot accurately report individual AUM. Those advisors have been omitted from our reported data on assets, productivity and account distribution, but remain part of the rest of the Report Card. To enable accurate year-over-year comparisons, Scotiabank’s advisors were retroactively removed from our 2018 data in these categories.
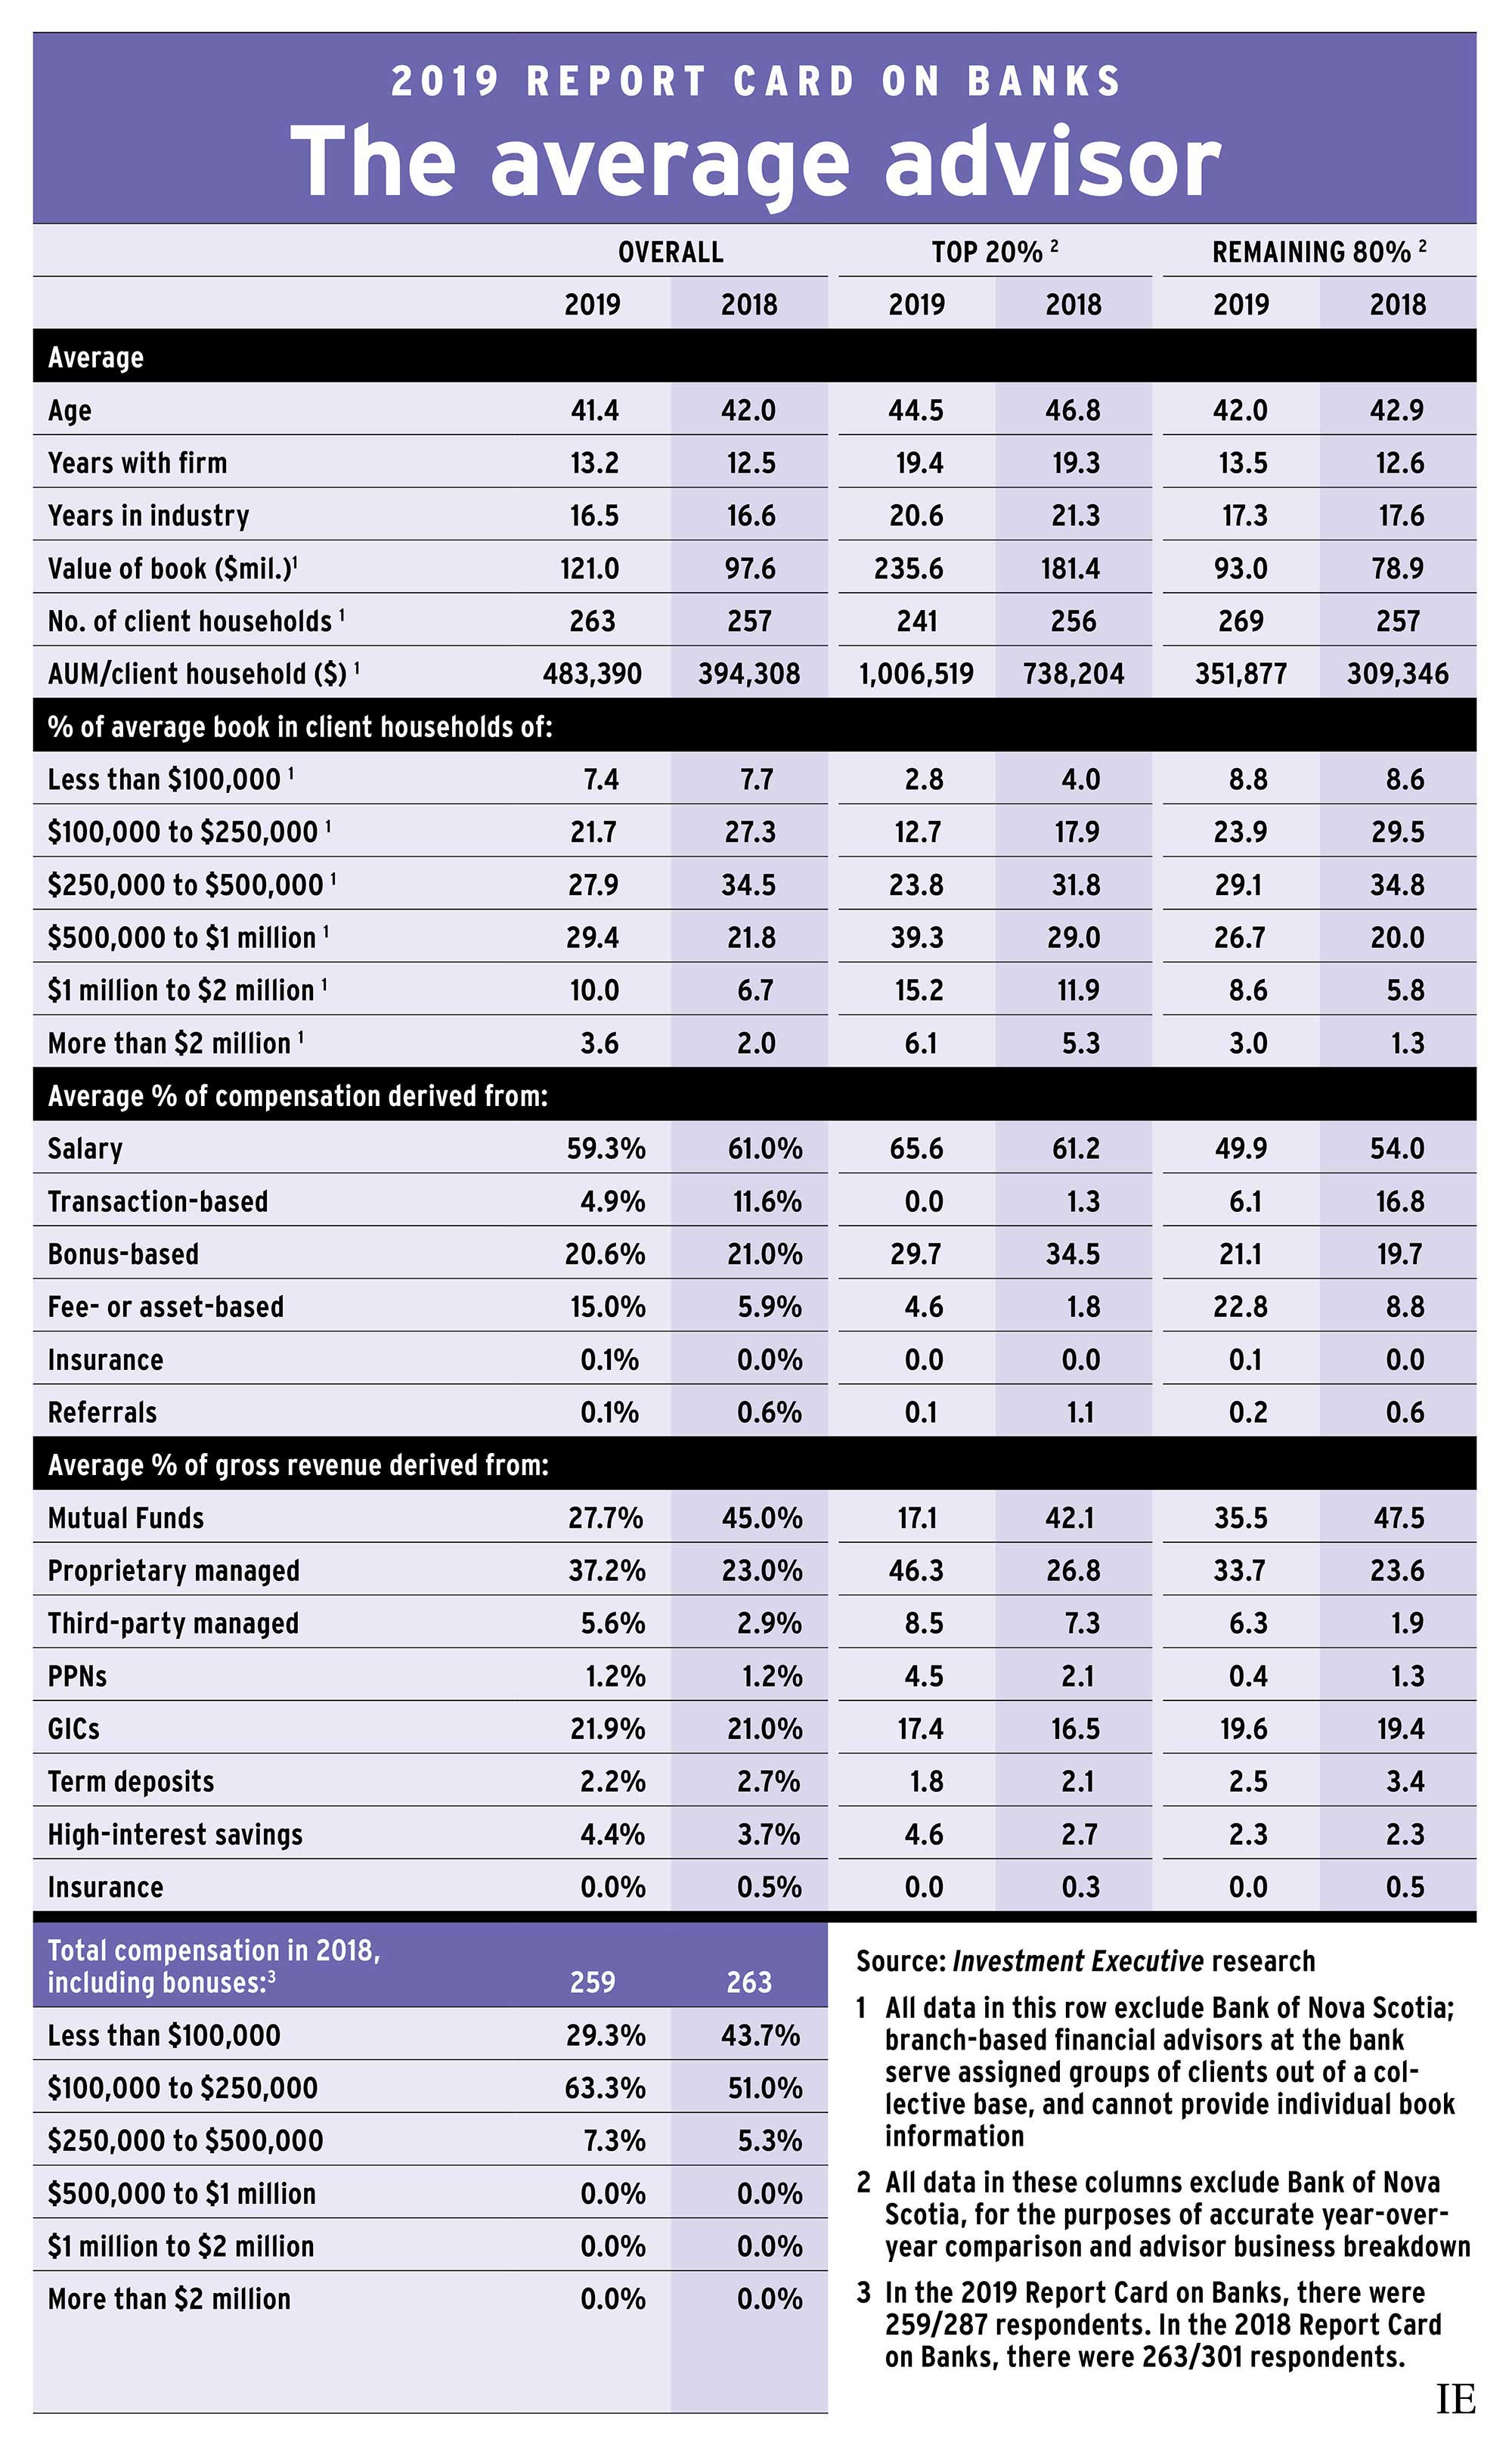
For the average advisor in 2019’s Report Card, reported AUM was $121.0 million, up 23.9% compared with last year’s $97.6 million. This strong increase wasn’t driven by bankers adding loads of new clients — the average number of client households only edged up to 263 from 257 in 2018.
Instead, the substantial rise in AUM was accompanied by significant productivity growth (as measured by AUM/client household). The average banker reported that AUM/household was up 22.6% compared with 2018, to more than $480,000.
This rise in productivity was also reflected in the account distribution data, which pointed to an increase in the proportion of higher-value accounts – particularly accounts worth more than $500,000.
The share of the average banker’s book that comprised accounts worth less than $100,000 was little changed from last year. Yet the share of accounts in the $100,000 to $250,000 range was down notably, as was the share in the $250,000 to $500,000 range. In 2018, the $100,000 to $500,000 range represented 61.8% of the average banker’s book. This year, that was down to less than half (49.6%) of the average book.
Concurrently, the share for every account category above the $500,000 mark was up compared with last year. In 2018, the average banker reported that 8.7% of their book was composed of accounts worth more than $1 million; this year, that proportion was 13.6%. Further, accounts worth more than $2 million now make up 3.6% of the average banker’s book, up from 2.0% last year.
Some of this shift may reflect market gains boosting the assets of existing clients; some may be due to attracting wealthier clients. But it’s likely that advisors added assets in other ways – such as by gaining a bigger share of clients’ overall wealth or by capturing liquidity events (such as inheritances or the proceeds from the sale of a business).
These same trends were evident among the industry’s top performers, defined as the top 20% as measured by AUM/client households. (Again, Scotiabank advisors were excluded from this portion of our analysis). The top 20%’s asset growth over the past year was particularly impressive. Average assets under management for these advisors was up about 30%, to $235.6 million, from $181.4 million in last year’s Report Card. Moreover, this dramatic increase came alongside a modest drop in client numbers, down to an average of 241 client households from 256 last year.
As a result, average AUM/household among the best performing advisors topped $1 million, up from less than $740,000 in last year’s Report Card.
For the other 80% of bankers, assets and productivity were also up year-over-year, but the gap between these advisors and the top performers widened. Average AUM for the rest of industry is up to $93.0 million this year from $78.9 million last year. While a solid increase from 2018, the 17.9% rate of asset growth was notably lower for this portion of the banker population compared with the top producers.
Similarly, while average productivity for the other 80% was more than $350,000 this year, up from slightly less than $310,000 last year, that metric grew more slowly in this segment of the bank advisor force than it did for the top 20%.
As a result, average AUM/household for the other 80% of bankers lagged the rest of the industry by more than $650,000 – an increase from around $420,000 in last year’s survey.
That weaker productivity growth reflects not only less robust asset gains than for the industry’s top performers, but the fact that these bankers also reported increased client numbers. On average, the other 80% served 269 households, up from 257 in our 2018 survey.
Notwithstanding the differences between the top 20% and the other 80% in terms of asset growth and productivity, both sides of the banker population reported similar changes in account distribution.
For the top 20% of bankers, accounts of $500,000 and less represented just 39.3% of the average book, down from 53.7% in last year’s survey. Among top performers, accounts in the $500,000 to $1 million range were the largest segment (at 39.3% of the average book). Accounts worth more than $1 million made up 21.3% of the average top producer’s book, up from 17.2% in last year’s survey.
For the rest of the industry, accounts in the $250,000 to $500,000 range remained the largest category, composing 29.1% of the average book, vs 34.8% in 2018. Yet here, too, the $500,000 mark represented an inflection point, with the share for accounts worth more than $500,000 rising to 38.3% this year from 26.8% in last year’s survey.
Bankers also reported higher pay. In this year’s survey, just 29.3% of bankers said they earned less than $100,000. This was down from 43.7% last year.
Concurrently, the proportion of bankers who reported earning between $100,000 and $250,000 was up to 63.3% from 51.0% year-over-year. Slightly more than 7% of bankers were in the $250,000 to $500,000 range, up from slightly more than 5% last year.
Bankers also reported a striking change in asset allocation within their books. Most notably, their use of mutual funds outside of managed products (e.g., in-house or external wrap products or accounts) dropped sharply, while their reliance on such products (particularly proprietary managed products) jumped dramatically compared with last year.
Overall, bankers reported that their allocation to mutual funds individually – last year’s most popular investment product option – dropped in 2019 to just 27.7% from 45.0%. Proprietary managed products were the most popular product category for the average book this year, with reported allocations jumping to 37.2% from 23.0% in 2018. Allocations to third-party managed products were also higher, albeit from a much lower level (rising to 5.6% of the average book from just 2.9%).
It appears banks’ own managed products are the primary beneficiary of this past year’s robust asset growth. The question of whether the banks can hold onto these assets in a less-friendly market environment will likely be a key issue in the years ahead.